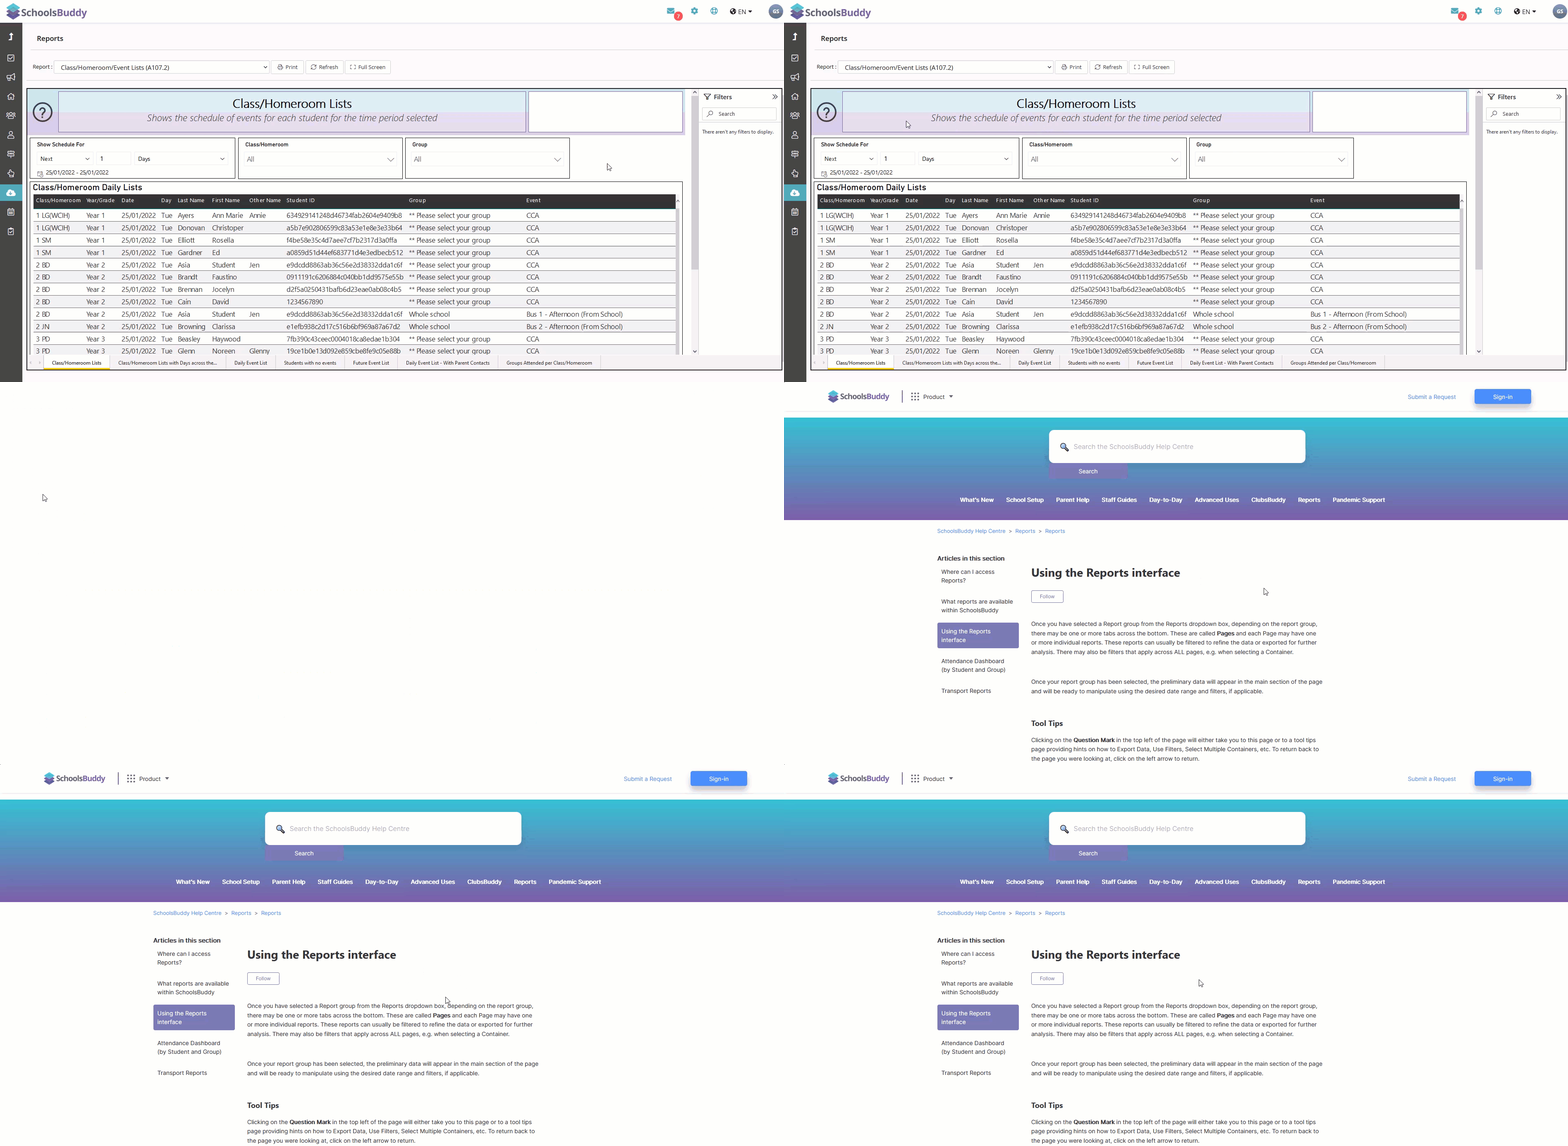
Once you have selected a Report group from the Reports dropdown box, depending on the report group, there may be one or more tabs across the bottom. These are called Pages and each Page may have one or more individual reports. These reports can usually be filtered to refine the data or exported for further analysis. There may also be filters that apply across ALL pages, e.g. when selecting a Container.
Once your report group has been selected, the preliminary data will appear in the main section of the page and will be ready to manipulate using the desired date range and filters, if applicable .
Tool Tips
Clicking on the Question Mark in the top left of the page will either take you to this page or to a tool tips page providing hints on how to Export Data, Use Filters, Select Multiple Containers, etc. If you are sent to a Tool Tips page within the report, to return back to the page you were looking at, click on the left arrow to return.
Please note, this is not available on every report at the moment. We are in the process of standardising the look of each report to include this, as well as your organisation's colour scheme, logo, etc.
Using the Filters on the page
There are various filters that may appear on a page such as a dropdown where you can select one or more items, a relative timescale where you can choose from various options such as weeks or months, a date slider filter, etc. There may also be buttons which provide shortcuts to the filtered data.

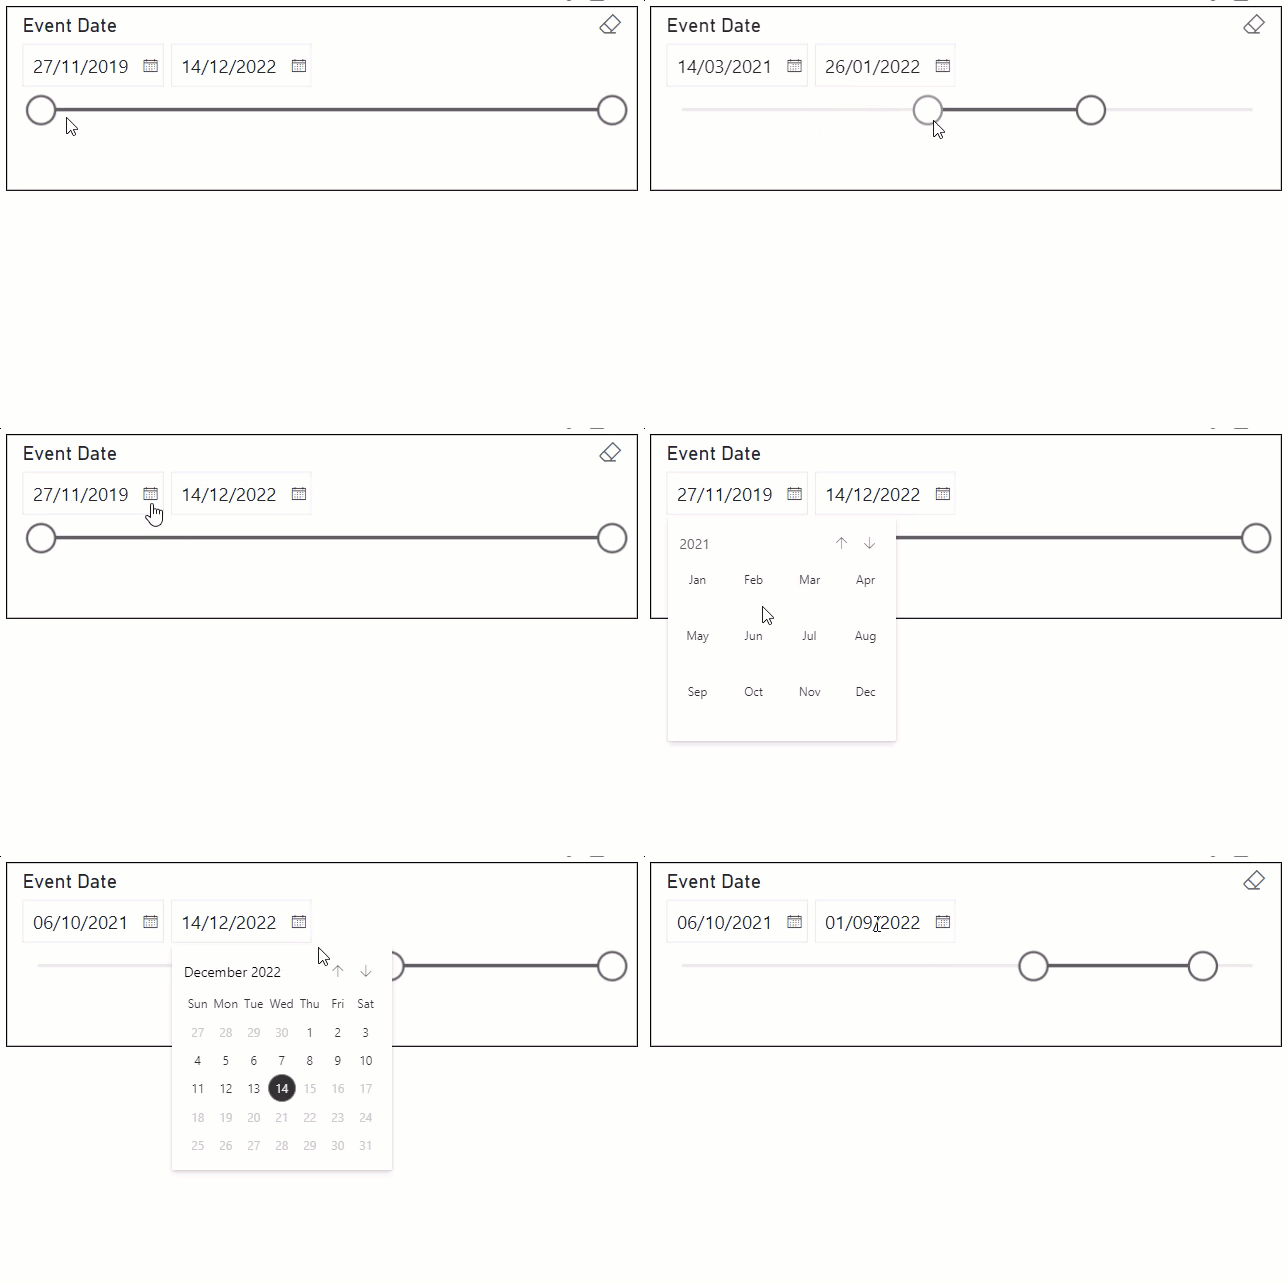
To use a data slider filter, simply drag the circles to provide a date range you require and the data will update automatically. You can also change the dates clicking on the calendar icon:
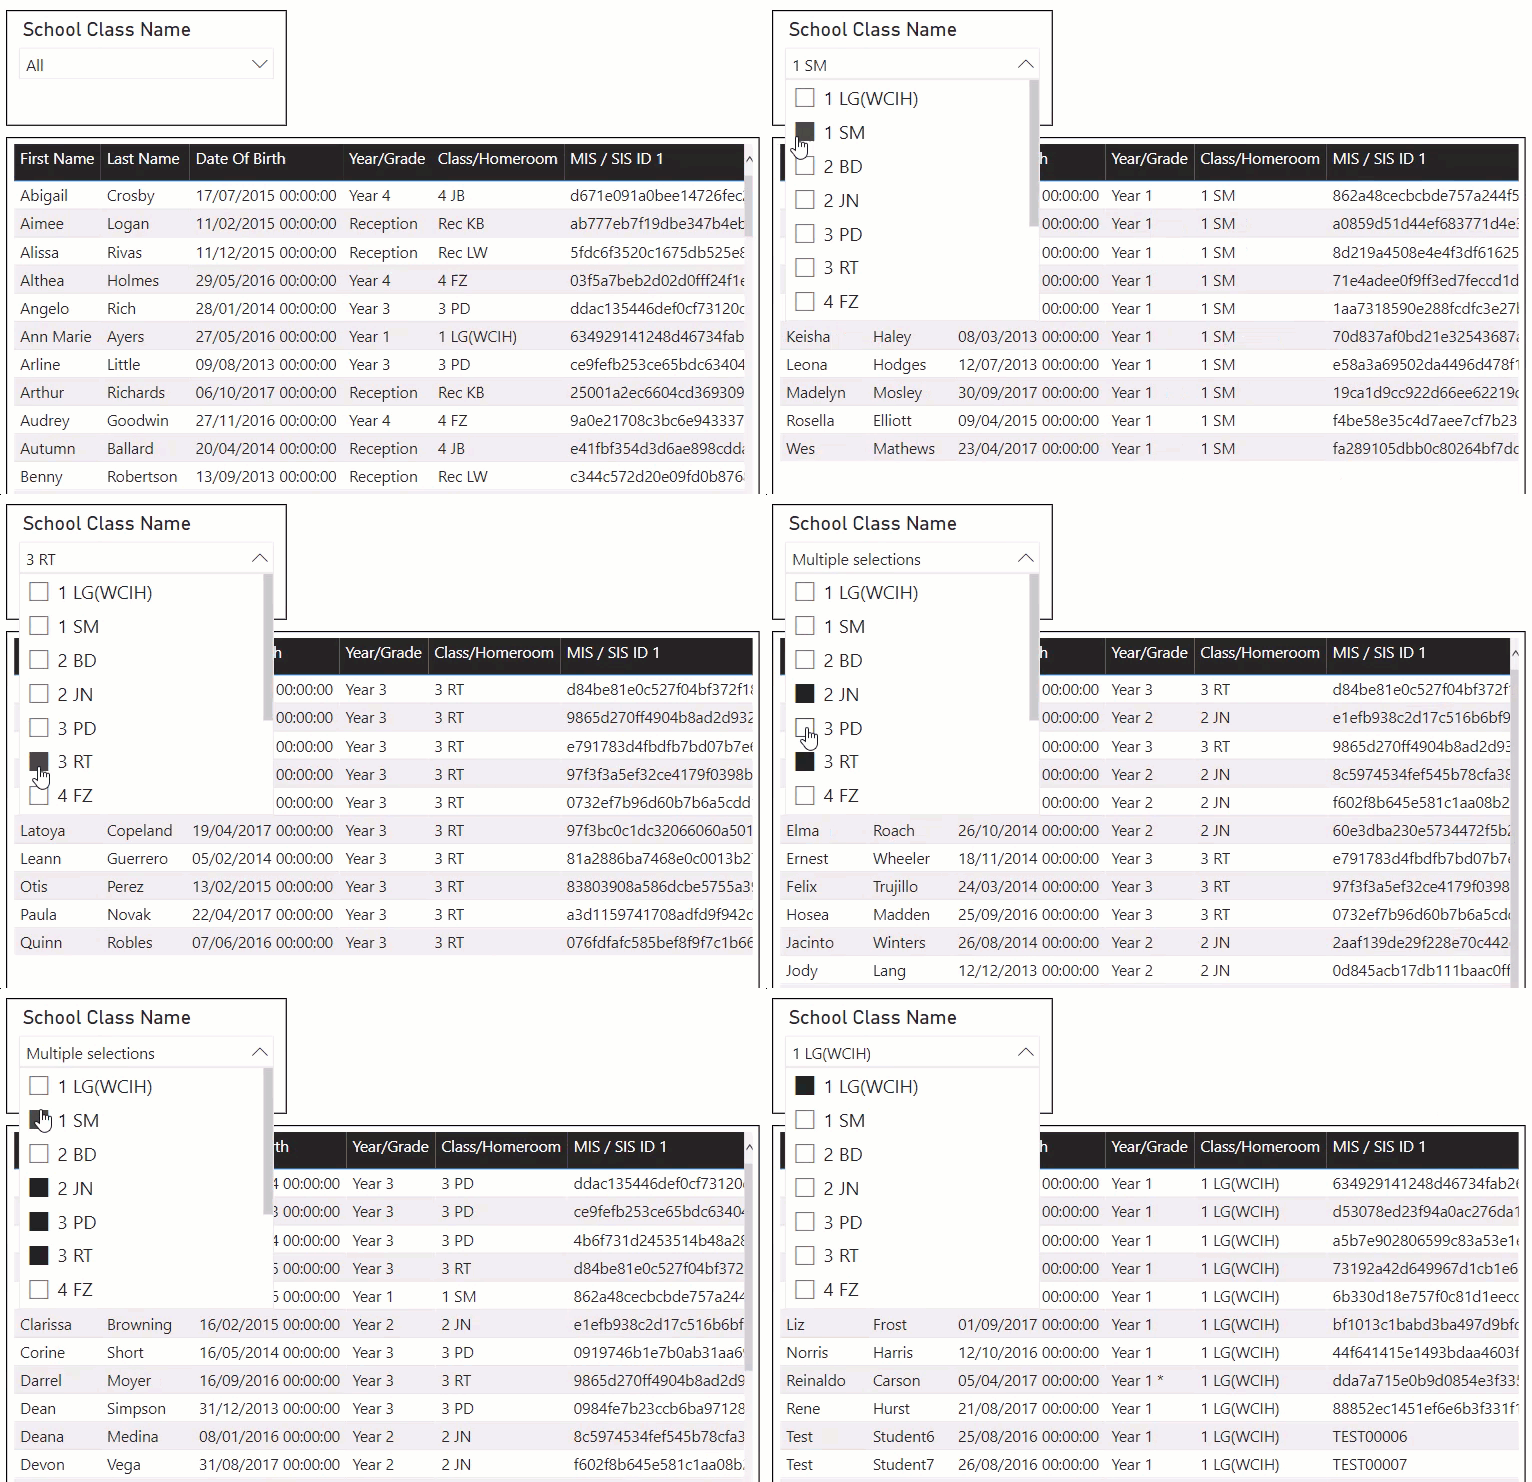
To use a dropdown to select one or more items, click on the down arrow for the filter and then click on the corresponding box for the item you require. To select more than one item (if possible) hold <CTRL> while selecting the box in Windows or the <COMMAND ⌘> key for MacOS
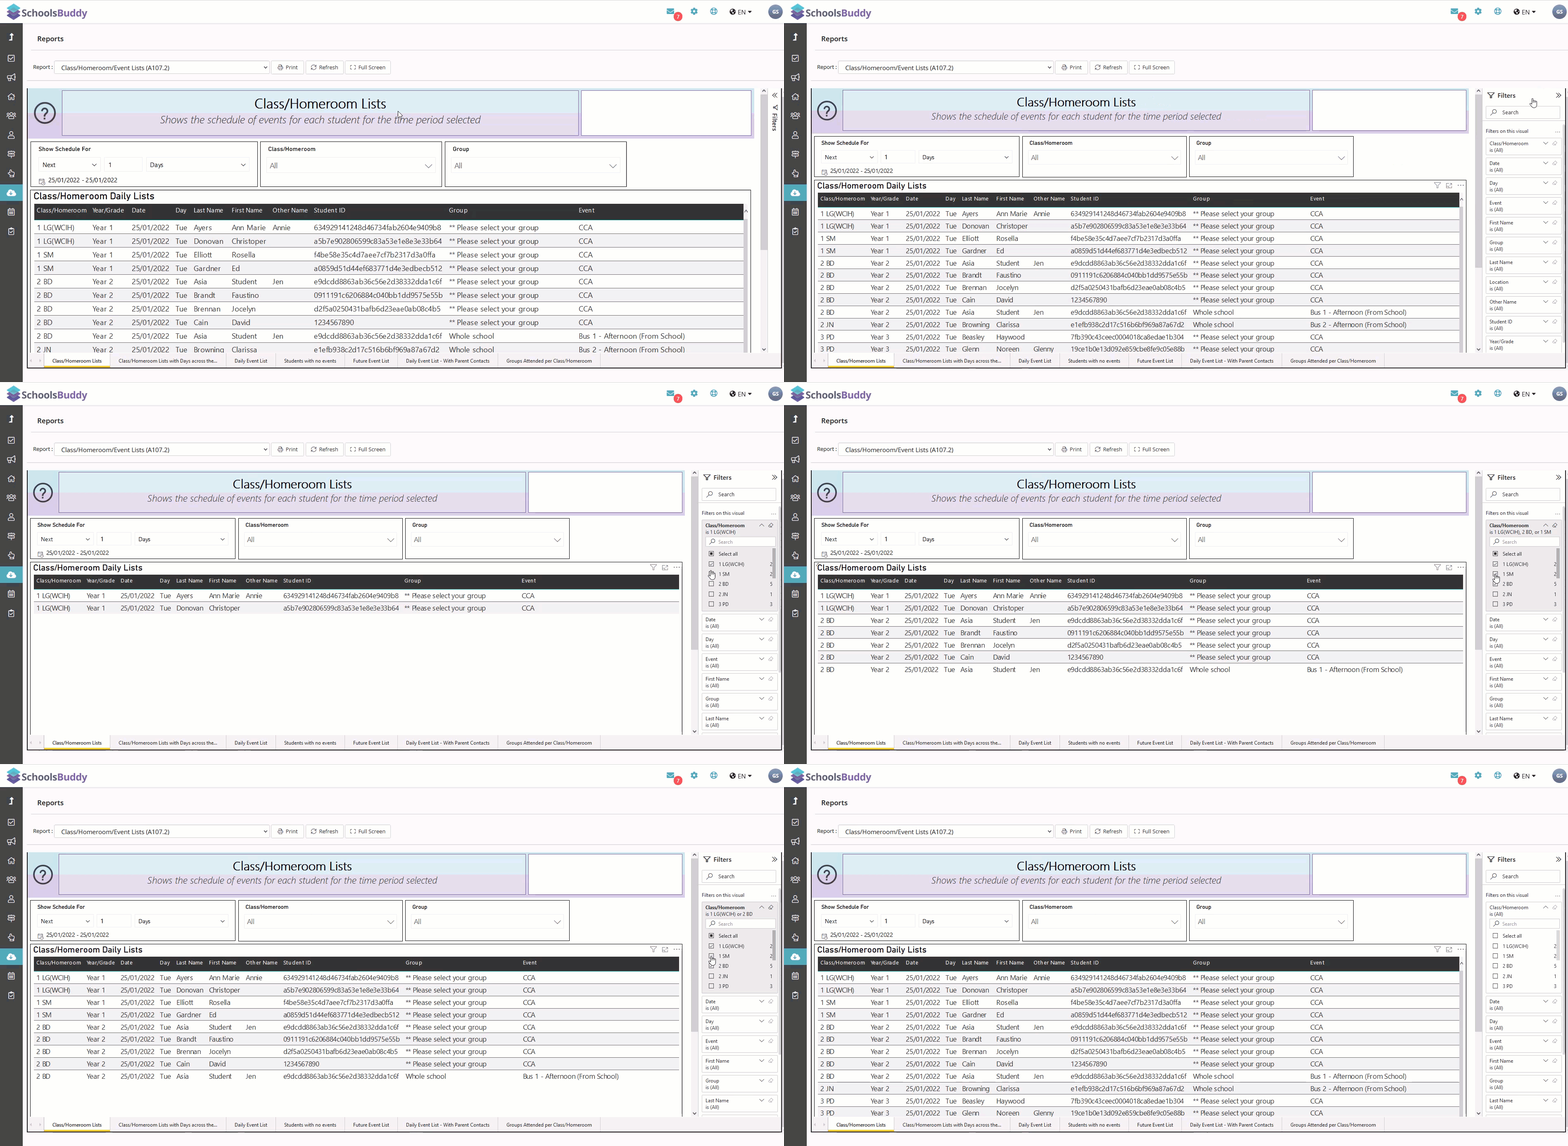
To use a filter from the Filter Pane:
If the filter pane on the left hand side is hidden, click on the left arrow to make it available.
- Click on the report you wish to filter.
- The Filter options will now be available to select.
- From the drop down box select your required filter by left clicking the arrow at the top right of the filter.
- Select your criteria and the report will update automatically.
- Sometimes, the filter will need you to click on Apply Filter for the filter to be activated.
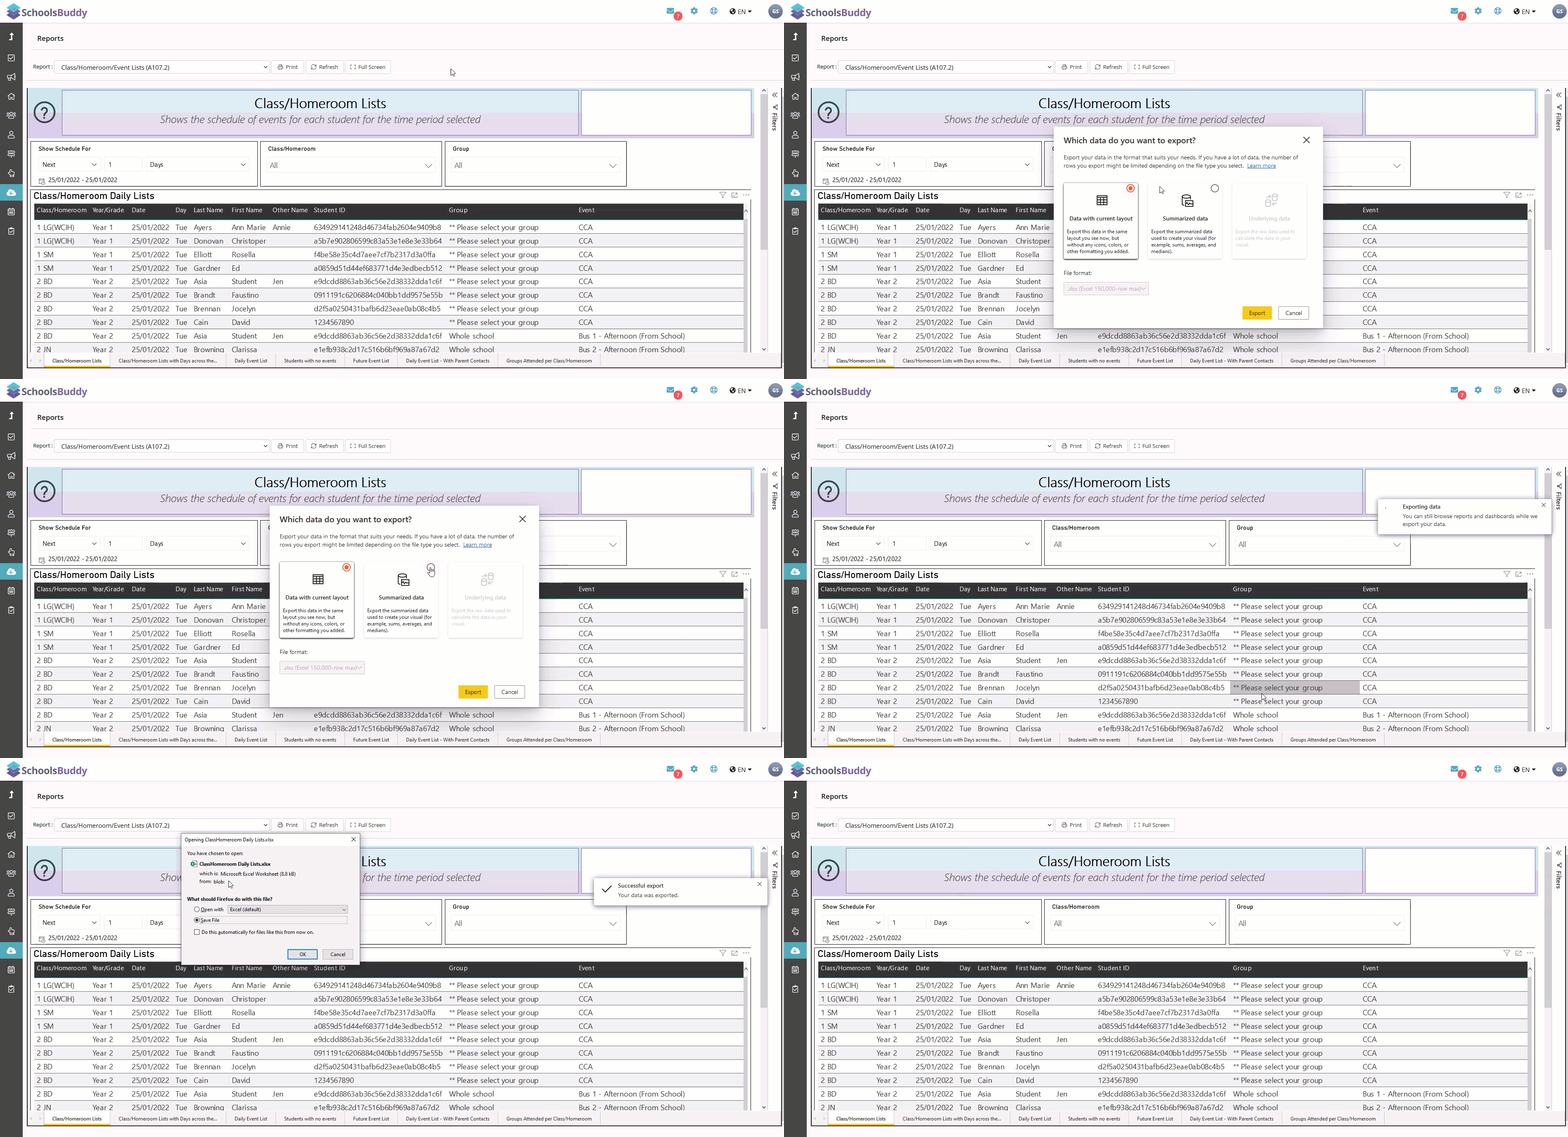
To export a report:
- Move your mouse to the top right of the report
- Left click the three dots that appear
- Left click Export data from the pop up menu
- you can choose between Data with current layout (as an Excel .xlsx file) or Summarized data (CSV or Excel .xlsx file)
- Left click the yellow export button
Printing a report
SB Reports is Microsoft Power BI Embedded. While this product offers flexible and quick to build reports it has some limitations and one is printing. Printing is a print screen function and one that is not 'fantastic'. Printing large or multiple page documents simply doesn't work, we would recommend exporting the data to Excel where you can adjust the columns, page margins, etc. If you find that you do need to print a document within reports, we suggest the following method:
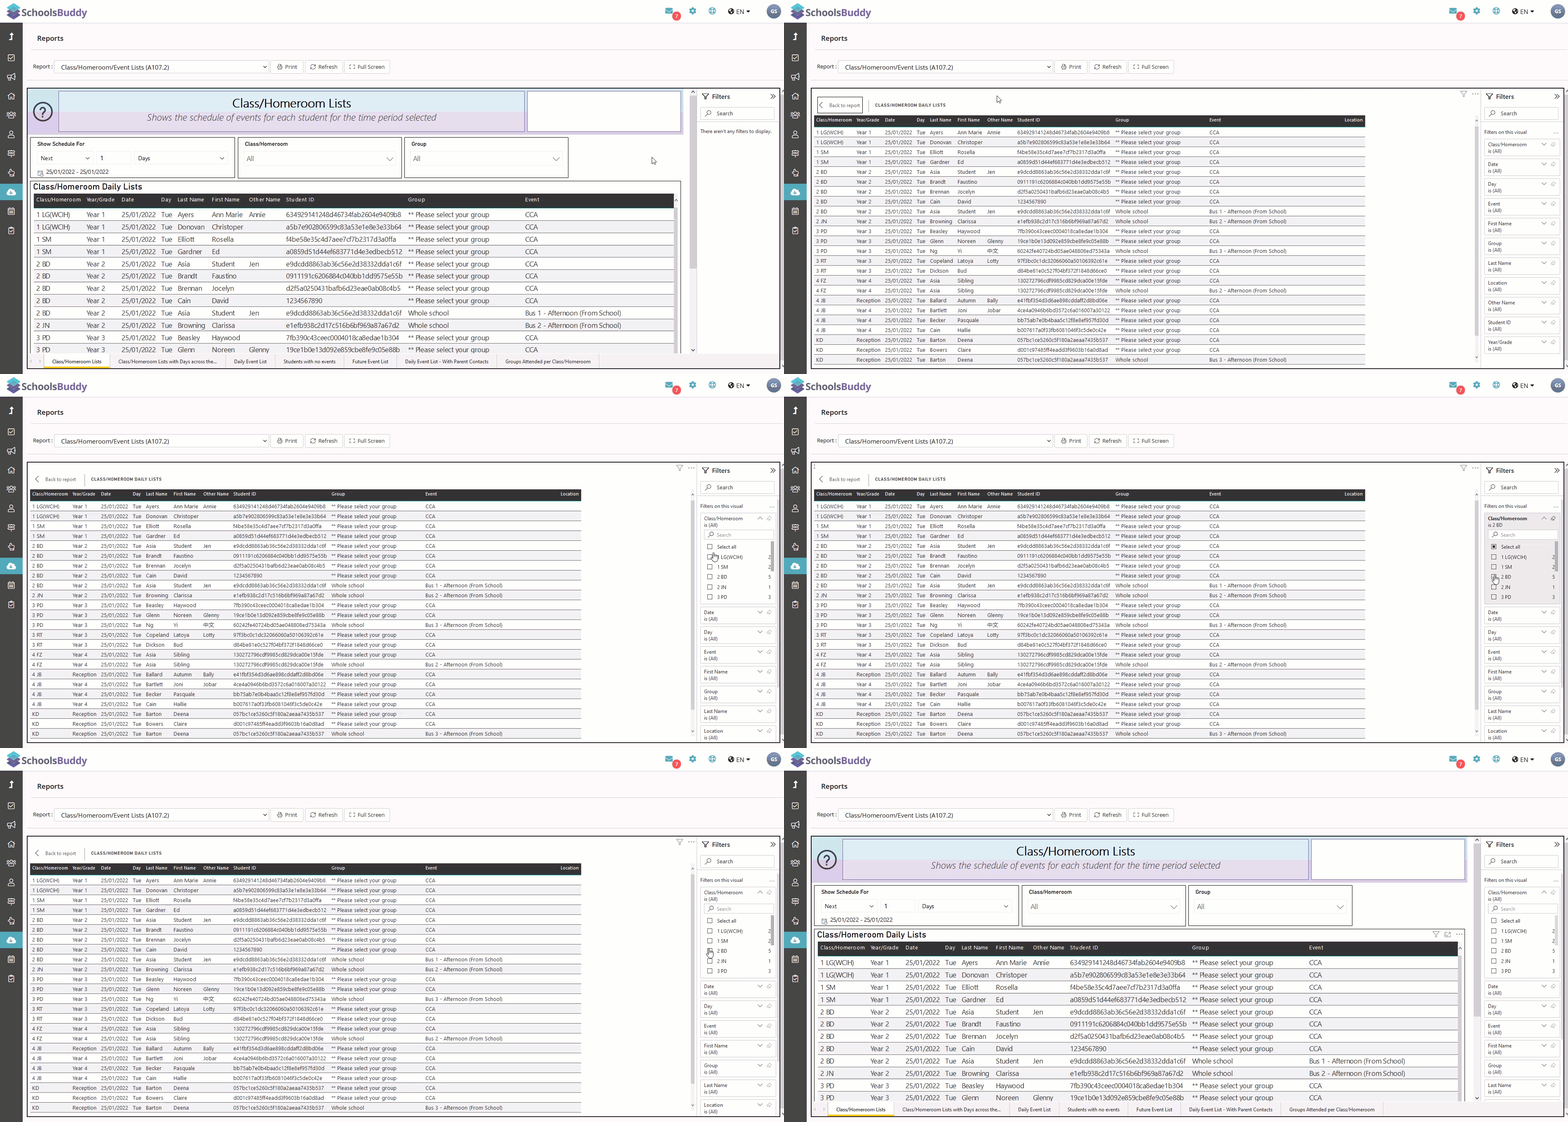
- We recommend using Full screen mode before printing. Left click the full screen button next to the print button.
- Press the print screen button on your keyboard or use a screen grab app/program to create a screenshot of your data
- Paste the screenshot into your desired program and save as a pdf ready to print
Using Focus Mode
Focus mode is useful as it highlights the selected information and removes everything else from the screen. To apply focus mode move your mouse to the top of the report and left click the box to the left of the three dots.
Using focus mode in conjunction with full screen, will enable you to gain the biggest screen area possible for printing or screen grabbing your report.
Click here to see which reports are available within SchoolsBuddy
